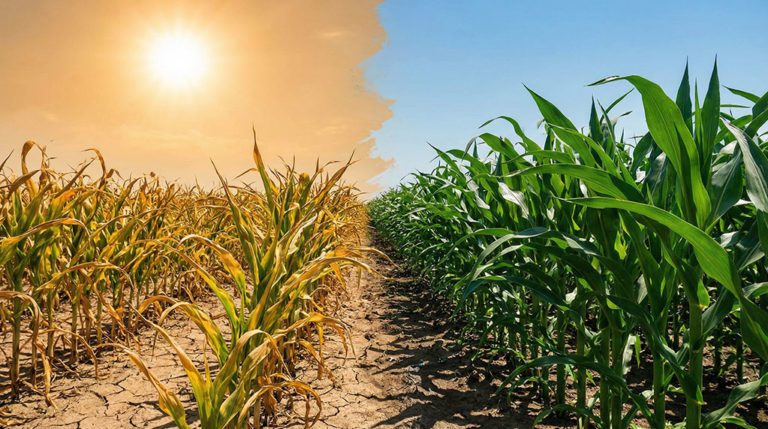
Global Context and Why Water is the Strategic Constraint
Agriculture remains the world’s largest consumer of freshwater – accounting for approximately 70–72% of global withdrawals. Furthermore, per capita availability of renewable water has fallen by 7% over the last decade, according to the FAO AQUASTAT 2025 update and UNESCO/WWDR 2024 syntheses.
The new global landscape also reveals sharp regional disparities regarding water stress and Water Use Efficiency (SDG 6.4 indicators). In certain regions, agriculture accounts for >80% of withdrawals, placing immense pressure on aquifers and basins under increasing climatic variability [1] [2].
North America: Expanding Water Precision
Key Challenge
The High Plains/Ogallala Aquifer continues to face declining levels and storage, severely impacting the corn and cotton belts and conditioning productivity under recurrent drought conditions. Recent reports (USGS/Kansas Geological Survey; USDA Climate Hubs; NIDIS/Drought.gov) document a trend of chronic depletion, emphasizing the need for basin-specific targets and demand-side management [3].
Irrigated Crops and Dominant Technologies
In the United States, center pivot systems serve corn, cotton, alfalfa, and specialty crops. Current trends include automation via telemetry, soil/plant sensors, and Evapotranspiration (ET) modeling.
Research from Kansas State (2025) indicates that reducing pivot speed increases the effective infiltrated depth, which can cut losses and improve yields without additional CAPEX.
Efficiency assessments report a potential savings of up to ~25% when maintenance, pressure, and uniformity are corrected.
In the Central Nebraska Plains, experiments with pivot-mounted sensors (thermal/multispectral) demonstrated reduced application rates while maintaining yields, paving the way for automated irrigation triggers based on thermal stress [4] [5].
Proven Best Practices
System Diagnostics/OPTIM: Assessing pressure, regulators, nozzles, and uniformity to reduce under-application and losses from drift or evaporation [4].
Sensor-Driven Scheduling + ET: Utilizing thermal windows (irrigating during cooler periods) to minimize evaporation [4].
Adaptive Management of the Ogallala: Regional initiatives (Ogallala Aquifer Program) targeting irrigation technologies and local demand governance [3].
Technical Message: In major U.S. irrigated hubs, incremental efficiency (O&M + control) delivers immediate gains; automation and on-pivot sensors accelerate productivity per drop with a rapid operational payback [5] [4].
South America: Soil-Water Conservation and Precision Irrigation in the Tropical/Subtropical Arc
Brazil: Data, Management, and Sustainable Intensification
Water Profile 2023/2024: According to the Water Resources Conjuncture Report (ANA, 2023), irrigation accounts for ~50.5% of the country’s water withdrawals (64.18 trillion liters/year), surpassing urban supply (23.9%) and industry (9.4%). Extreme events, including floods (1.5 million affected) and droughts (7 million affected), increased during the 2022–2023 period [6].
Irrigated Crops by Hub: Rice (South); sugarcane (Center-South); specialty crops and coffee (Southeast); grains (soybeans/corn) under pivots in the Cerrado/MATOPIBA regions. Expansion and modernization of pivots and drip irrigation have stabilized harvests amidst irregular rainfall [7].
Core Conservation Practices
No-Till System (SPD): The Brazilian federation (FEBRAPDP) estimates >33 million ha under SPD, reducing erosion while increasing infiltration and water/biogeochemical recycling [7].
Crop-Livestock-Forest Integration (ILPF): Recent estimates from the ILPF Network indicate ~17.4 million ha, with sector analyses suggesting ~20.1 million ha by 2024. This consolidates ILPF as a lever for infiltration, shading, organic matter, and water stability [8].
Proven Best Practices
“Authentic” No-Till System (SPD): Based on its three core pillars plus crop rotation, it improves field capacity, infiltration, and the reduction of runoff, thereby preserving water within the soil profile following Embrapa/FEBRAPDP guidelines [7].
Diffuse Capture (“Barraginhas”) and Drainage/Terraces: When combined with No-Till systems, these techniques expand local recharge and dampen peak rainfall events, a practice widely used in the Cerrado with supporting technical literature [7].
Pivot + Sensors/Telemetry + ET in Grains: Gains of over 25% in water use efficiency are achievable when system maintenance and scheduling are optimized (evidence extrapolated from K-State for similar systems) [4].
Argentina and Chile: Technified Irrigation under Climatic Variability
Argentina: The production base for soybeans, corn, wheat, and sunflowers is primarily rainfed (irrigation <3% of the area for these crops). Irrigation is concentrated in fruit/viticulture (Cuyo/Patagonia). While 2025/26 reports show record wheat production (27.8 Mt), the low participation of irrigation highlights climatic dependency and the vital role of soil/water conservation in rainfed systems [9].
Chile: Faced with a mega-drought, agriculture – specifically vineyards and fruit orchards – has accelerated the adoption of drip/micro-irrigation and sensor-based control. Field studies in Maule vineyards showed that deficit irrigation (-25% to -50%) maintained productivity and increased Water Use Efficiency (WUE) [10].
Europe: Regulation + Technology + Reuse
The EU operates under the Water Framework Directive (WFD) and the CAP 2023–27 (ecoschemes), which reinforce quality/quantity targets and incentives for low-water-impact agriculture [11].
Where and How Much is Irrigated
Eurostat data (from the most recent complete cycle published) indicate that approximately 5.9% of the Utilized Agricultural Area (UAA) was effectively irrigated in 2016. Italy and Spain lead in terms of irrigable area. A methodological update (IFS 2023) is scheduled for 2026. Irrigation in the Mediterranean basin supports olive groves, vineyards, industrial tomatoes, horticultural crops, and spring cereals, typically via drip or pressurized systems [11].
Reuse as a Structural Source (Spain in Focus)
Murcia recycles approximately 98% of its municipal effluent (meeting disinfection standards) [12]. This supply covers about 15% of regional irrigation demand, serving as a benchmark for safe agricultural reuse under water scarcity.
Recent assessments identify both barriers and solutions regarding salinity, emerging contaminants, and institutional arrangements. These studies also highlight the economic and environmental viability, including nutrient recovery and lower supply chain emissions, for reuse in southern Spain, in alignment with Regulation (EU) 2020/741 [13].
European sector syntheses indicate that agriculture accounts for approximately 28% of water abstractions in the EU. Furthermore, efficient irrigation technologies, such as drip irrigation, offer water savings ranging from 10% to 46% depending on the type of crop. These systems also contribute to a reduction in pumping energy of up to 50% [11].
Comparative Framework – Primary Crops and Irrigation Trends
| Region | Relevant Irrigated Crops | Technology/Management Trends | Efficiency Evidence |
|---|---|---|---|
| North America | Corn, cotton, alfalfa, specialty crops | On-pivot sensors, telemetry, ET/automation, speed adjustment | Up to ~25% savings; maintained yields with reduced depth [4] [5]. |
| South America (BR) | Rice, sugar, coffee, grains (pivots) | No-Till (SPD), ILPF, rainwater harvesting, optimized pivots | Increased infiltration; >25% gains in water efficiency [7] [8] [4]. |
| South America (AR/CH) | Fruit, viticulture (Chile); Rainfed grains (Argentina) | Drip/micro, controlled deficit, reuse (Chile) | –25% to –50% water depth maintaining yield and ↑ WUE [9] [10]. |
| Europe (Med.) | Olives, vineyards, tomato, cereals | Low-pressure drip, climate automation, reuse (Spain) | Reuse covers ~15% of irrigation; 10–46% savings with drip [12] [11]. |